Give me a business and a number to hit. I find what is holding it back, whether that is the offer, the creative, the tracking or the operation behind them, then build or rebuild that piece until the number moves.
No store, no traffic, no list, no baseline. One product and a budget.
The problem
Traffic is cheap here, which is exactly the trap. Cheap clicks let you spend for weeks without ever learning whether people want the product at the price you are asking. Spend before that is settled and you buy data nobody can act on.
What I did
Chose the product, set the offer and the price, wrote the copy and the video scripts, built the product page. Tested five angles across different video formats to find which one people reacted to, then scaled only the winners in explicit budget tiers so the cost of scaling stayed visible.
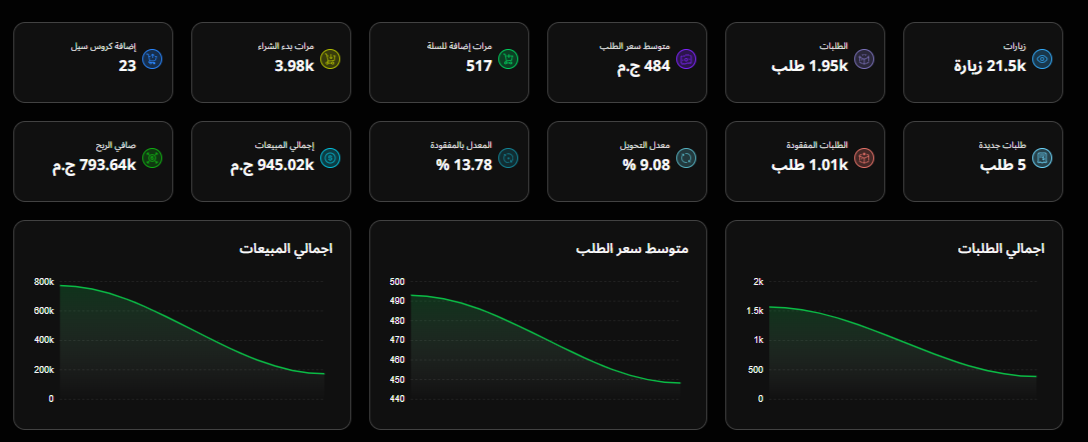
Those are confirmed orders rather than delivered ones. A third of the orders placed were cancelled before confirmation, and Egyptian cash on delivery keeps refusing after that, which puts the delivered return closer to 11.5x.
Scroll the dashboard sideways to read it all.
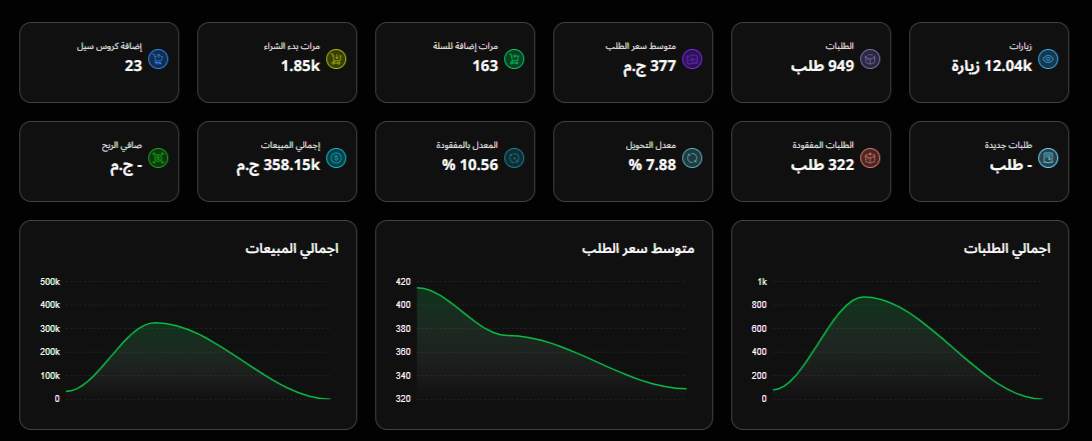
Sessions times conversion rate reproduces the order count, and orders times average order value reproduces the sales figure.
Home water filtration · Egypt
What scaling costs, measured
EGP 358,150confirmed sales
949confirmed orders
7.88%conversion rate
EGP 377average order value
Starting point
Again from zero, at a lower price point, on a product people judge on trust rather than on looks.
The problem
Every account looks efficient at a small budget. The question that decides whether a launch is a business or a fluke is what happens to that efficiency when you multiply the spend.
What I did
Settled the winning angle first, then moved through one test tier and two scaling tiers, watching cost per acquisition rise from roughly EGP 21 to EGP 32 on the way up. Knowing that number in advance is what makes a budget forecast honest rather than hopeful.
Scroll the dashboard sideways to read it all.
Herbal wellness · Palestinian market · first month
Dollars, and an offer that paid for itself
~$20,000sales, first month
~8xreturn on ad spend
~$3cost per acquisition
90%+net delivery rate
Starting point
A different economy from the Egyptian work: card payments instead of cash on delivery, higher CPMs, and almost none of the orders falling away after they are placed.
The problem
At a low unit price, acquisition cost eats the margin on a single-unit order. Winning on media alone was never going to make this profitable.
What I did
Built the margin into the offer rather than chasing a cheaper click. Priced quantity tiers so net profit per order roughly doubled between one unit and three, and matched add-ons to what was already in the basket instead of pushing a bigger order.
This one ran inside the client's own ad account, so there is no dashboard of mine to show.
Rasd, and you can open it yourself
Three launches in, the question that decides the next one never changes: what is worth testing and scaling now. Most people answer it from instinct and a scroll through competitors' ads. I got tired of answering it that way, so I built something that answers it from measured demand across an entire supplier network rather than from one store's own sales.
It updates itself continuously behind a verification gate that refuses to publish when the data does not check out, and it returns no answer at all rather than extrapolating from thin history. That refusal was a deliberate design decision: a number nobody can stand behind is worse than a blank space.
It is running now, so rather than describe it, here is a login.
Understanding a business before spending money inside it is the same discipline whether the money is an ad budget or a software build. A system that does not match how the business really runs gets worked around within a month, so I research it first, map what happens today, find where value leaks out of the process, then specify the screens against that. Twelve industries researched, seven designed.
Two working prototypes
Open them in your browser, in Arabic
Each one shows the workflow analysis alongside the screens it produced, so you can see what the design was reasoning from rather than just what it looks like.
Healthcare
Private hospital
Admissions and approvals, bookings, clinic scheduling, the bed map, inpatients, critical units, medical orders and nursing procedures. A regulated operation where the paperwork is the process, and where a missing approval number is a bill nobody can collect.
Supply and suppliers, items, costing and distribution, payments, certificates, and clearance pricing. Built around seasonality and the cash problem that arrives with it, where last season's stock is this season's liquidity.
Three things carry every launch above: how the campaigns are structured, the measurement that makes the numbers worth quoting, and the operation that has to survive the volume when the budget grows.
Campaign structure
Test and scale never share a campaign
Campaign naming is not housekeeping. Test and scale live in separate campaigns, the daily budget tier is written into the name, and each angle is isolated so it can win or lose on its own. Six months later it is still obvious what produced a result and what merely happened at the same time.
Scroll the table sideways to read it all.
Cost per purchase climbs from the test tier to the scale tier. That rise is the price of scale. Why it happened, and what I did about it, tells you more than any single return figure.
Scroll the table sideways to read it all.
TikTok run alongside Meta and read against it, so budget moved on evidence rather than on preference.
Measurement
Tracking built, not assumed
Meta Pixel with the server-side Conversions API, GA4 with Tag Manager, and a UTM taxonomy consistent enough that revenue traces back to the campaign that produced it. None of the figures on this page would mean anything without that layer, which is why it gets built at the start rather than reconstructed at reporting time.
Operations
The operation has to survive the volume
Order confirmation, courier handover and stock control, set up so that scaling the ads does not break what sits behind them. In a cash-on-delivery market this is where a good campaign quietly turns into an expensive one: orders that cannot be confirmed, stock that runs out mid-flight, couriers that return a third of the boxes.